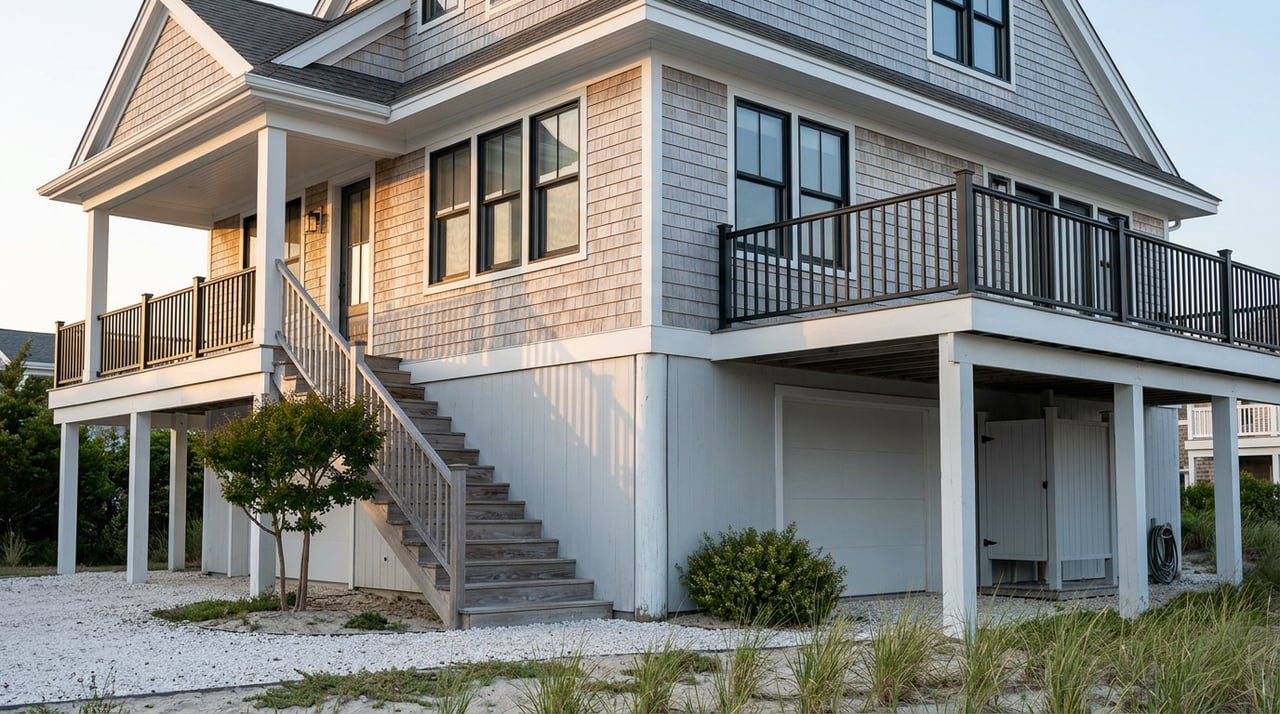
Surf City is barely a quarter mile wide through its center, ocean on one side and bay on the other, blocks so short you can walk from the beach to a boat slip in the time it takes to finish a coffee. It is one of the smallest towns on Long Beach Island by footprint. It is also one of the hardest to price by headline, because different reporting windows can tell two very different stories depending on which report you happen to open.
Pull up a rolling three month window ending in May 2026 and the median sale price in Surf City sits at $2.3 million, up 8.7 percent from the year before. Pull up the single month figure for June 2026 and the number jumps to $3,348,178, a swing of 83.5 percent year over year. Same town, same data provider, two numbers that would suggest completely different markets if you didn't know why they diverge.
They diverge because Surf City isn't one market wearing one price tag. It's two distinct sections sharing a zip code, and a sales volume so thin that a handful of closings can swing the headline number without a single home actually changing in value.
Two Numbers, One Town
Here's what a buyer or seller researching Surf City is likely to encounter across different platforms in the same season:
| Metric | Window | Figure |
|---|---|---|
| Rolling median sale price | Three months through May 2026 | $2.3 million, up 8.7% year over year |
| Single month sale price | June 2026 | $3,348,178, up 83.5% year over year |
| Homes sold | May 2026 | 10 homes, down from 16 the year before |
| Average home value index | As of May 2026 | $1,674,385, up 9.9% year over year |
None of these numbers are wrong. They're measuring different things over different windows, and in a town this small, the difference between windows is the whole story. With just ten sales in a month, monthly figures can move in big, uneven steps. That monthly count is not the sample behind the rolling three-month median. A home value index that smooths across every property, old and new, tells a calmer story than a monthly figure driven by whichever handful of homes happened to close. Neither one tells you what your specific budget buys, because Surf City's price data is really two data sets stitched together.
Why a Quarter Mile Splits Into Two Markets
Locals describe Surf City in two halves, and the split shows up in the listings. The North End carries larger homesites, more frontage on both the bay and the ocean, and the highest per-square-foot new construction pricing on the island. Walk south toward the causeway and the town gets denser and more commercial, home to the retail strip along the Boulevard where shops like Okie's Butcher and Anchor Produce sit a short walk from older, tighter-lot cottages that have been in the same families for decades.
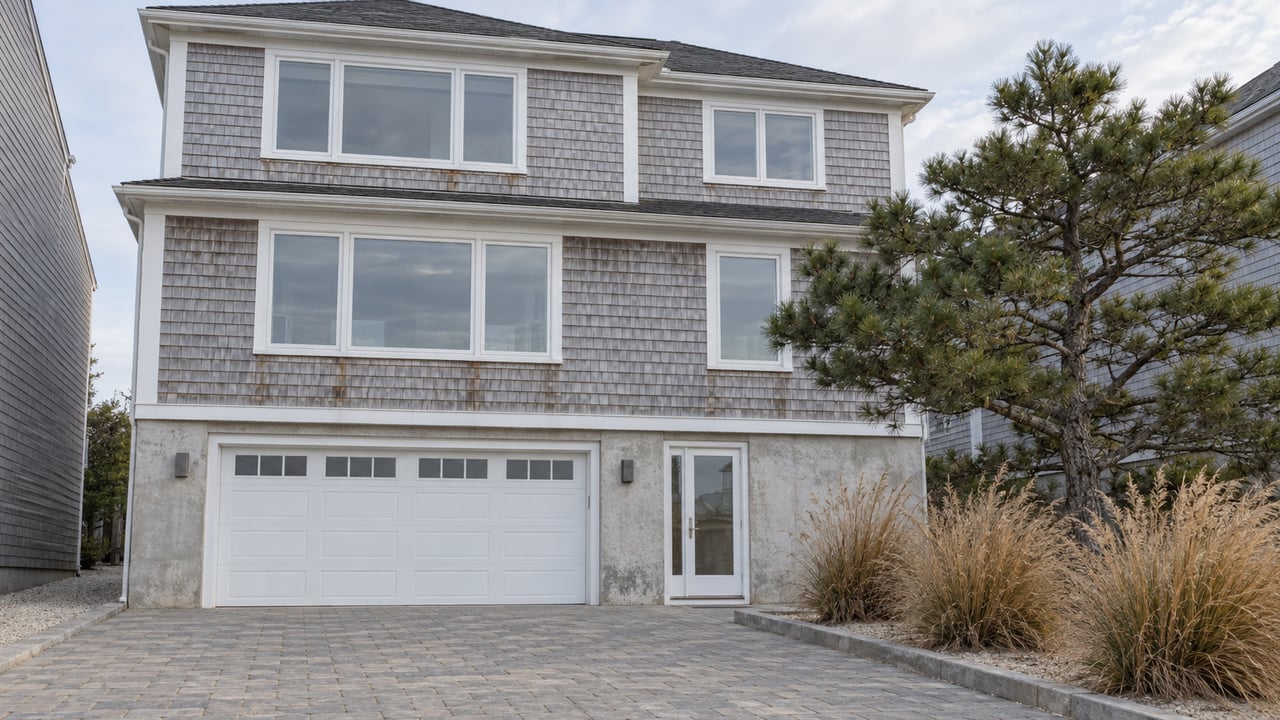
This isn't a story about one part of town being better than the other. It's a story about two very different products being sold under the same municipal name. A newly built five bedroom home on a wide North End lot with bay and ocean views is not competing in the same price tier as a modest four bedroom cape three blocks south, even though both would show up in the same "Surf City" search. When a reporting window happens to catch three North End new construction closings, the median jumps. When it catches a run of older South End cottages instead, the median drops back down. Nothing about the underlying market moved. The mix of what happened to sell that month did.
Ten Sales Is Not a Dataset
The other half of the mechanism is volume. Surf City recorded just 10 home sales in May 2026, down from 16 the year before. At that scale, a single-month median can be volatile. It's closer to a coin flip weighted by whatever happens to close escrow.
Think about what one $4 million North End estate and one $1.3 million older cottage do to a ten-sale sample. Swap either one out for a different price point and the reported median can move by six figures without any comparable home losing or gaining value. This is why a single month's year over year percentage change in a town like Surf City should be read as a description of that month's transaction mix, not as a verdict on where the market is heading. Multi month medians smooth some of this out, which is part of why the three month figure through May 2026 and the single month figure for June 2026 tell such different stories from the same underlying pool of homes.
New Construction Carries Its Own Weight
There's a third factor pulling the numbers upward, and it isn't going away soon. Long Beach Island's new construction market closed the first quarter of 2026 at an average of roughly $1,158 per square foot, and Surf City was named alongside Harvey Cedars as leading the island in per-square-foot new construction pricing. Builders on the island reported a list-to-sale price ratio of 99.66 percent for the quarter, which means new homes are selling at essentially full asking price with almost no negotiation room.
Projects like the Bay Block new construction built by Mike Pagnotta illustrate why. A newly built home with an elevator, a heated pool, and bay frontage commands a per-square-foot price that an older, unrenovated cottage simply cannot match, no matter how good the location. When even one or two of these new builds close in a given month, they don't just add a high number to the pool. They pull the whole month's average toward the top of the range, because new construction in Surf City is priced at a meaningfully different tier than the resale inventory sitting next to it.
What This Means If You're Pricing a Home Here
If you're comparing Surf City to another LBI town using the median you found on a portal, you're comparing an average of two different products to whatever that other town's own mix happens to be. That's not a useful comparison for deciding what your money buys or what your home is worth.
A few better questions to bring to a conversation about Surf City pricing:
- Is this comparable on the North End or closer to the Boulevard and the causeway
- Is it new construction, or built more than a decade ago
- Does it have direct bay frontage, ocean frontage, or neither
- How many comparable sales actually happened in the last 90 days, not the last 12 months
None of these questions require guessing. They require pulling the actual closed comparables for a specific block or section, filtered by construction vintage and lot type, rather than anchoring to a town-wide number that's mixing categories by design.
A Few Questions Worth Asking Before You Commit to a Number
Does a lower reported median mean Surf City got more affordable? Not necessarily. It may simply mean fewer new construction or North End estate homes closed in that window. The underlying value of comparable homes may not have moved at all.
Should I wait for the median to come back down before buying? That approach assumes the median reflects a single market correcting itself. In a town where the median is really an average of two different housing types shifting in and out of the sales mix, waiting on the headline number tells you very little about what a specific home in a specific section will cost.
How many recent sales should I actually look at before trusting a comparison? More than the three or four that typically populate a portal's snapshot. With sales volume this thin, a useful comparison usually means widening the window or narrowing the search to the section of town and home type that actually matches what you're evaluating.
Surf City's numbers aren't unreliable because someone made a mistake. They're unreliable as a single headline because the town itself isn't a single thing. If you're trying to figure out what a home in Surf City is actually worth, the conversation that matters is about the specific block, the specific lot, and the specific age of construction, not the number sitting at the top of a search result.
If you're weighing a purchase or a sale on Long Beach Island and want a read on what's actually happening on a specific street rather than a town-wide average, Paula Brennan can walk you through the comparables that matter for your situation. Let's Connect.