Ship Bottom looks like it just had its best spring in years. Homes that used to sit for five months found buyers in about a month. The average price per square foot nearly doubled year over year. If you're comparing towns on Long Beach Island right now, that combination reads like a market on fire.
Look just north to Surf City and the story gets more interesting, not because it contradicts Ship Bottom's numbers, but because it shows what a stable, deep housing market looks like sitting right next to a thin one having an unusual season. The two towns share a border, a school district, and a stretch of barrier island beach. Their price data right now looks like it belongs to two different economies.
The Numbers That Don't Add Up on Their Own
Over the three months ending May 2026, Ship Bottom's median sale price came in around $1.6 million, up 18.8% from the same window a year earlier. Price per square foot jumped to roughly $1,840, a 124.9% increase year over year. Homes that had been taking an average of 154 days to sell were now moving in about 32.
Surf City told a calmer version of the same story. Median sale price over the same three months landed near $2.3 million, up a more modest 8.7% year over year. Price per square foot rose 19.9%. Days on market fell from 120 to 65.
| Ship Bottom | Surf City | |
|---|---|---|
| Median sale price (3 mo. ending May 2026) | ~$1.6M | ~$2.3M |
| Price per sq ft, YoY change | +124.9% | +19.9% |
| Days on market, this year vs. last | 32 vs. 154 | 65 vs. 120 |
| Homes sold, May 2026 vs. May 2025 | 11 vs. 5 | 10 vs. 16 |
A 125% jump in price per square foot next to a 20% jump in the town right next door is not a story about one town suddenly outpacing its neighbor. It's a story about sample size, and about what kind of house happened to close.
What Actually Moved the Average
Ship Bottom sold 11 homes in May 2026, up from 5 the year before. That's real growth in activity, but it's also a small enough set of transactions that a couple of unusual sales can swing the entire average. When a market goes from five closings to eleven, the composition of those eleven matters as much as the count.
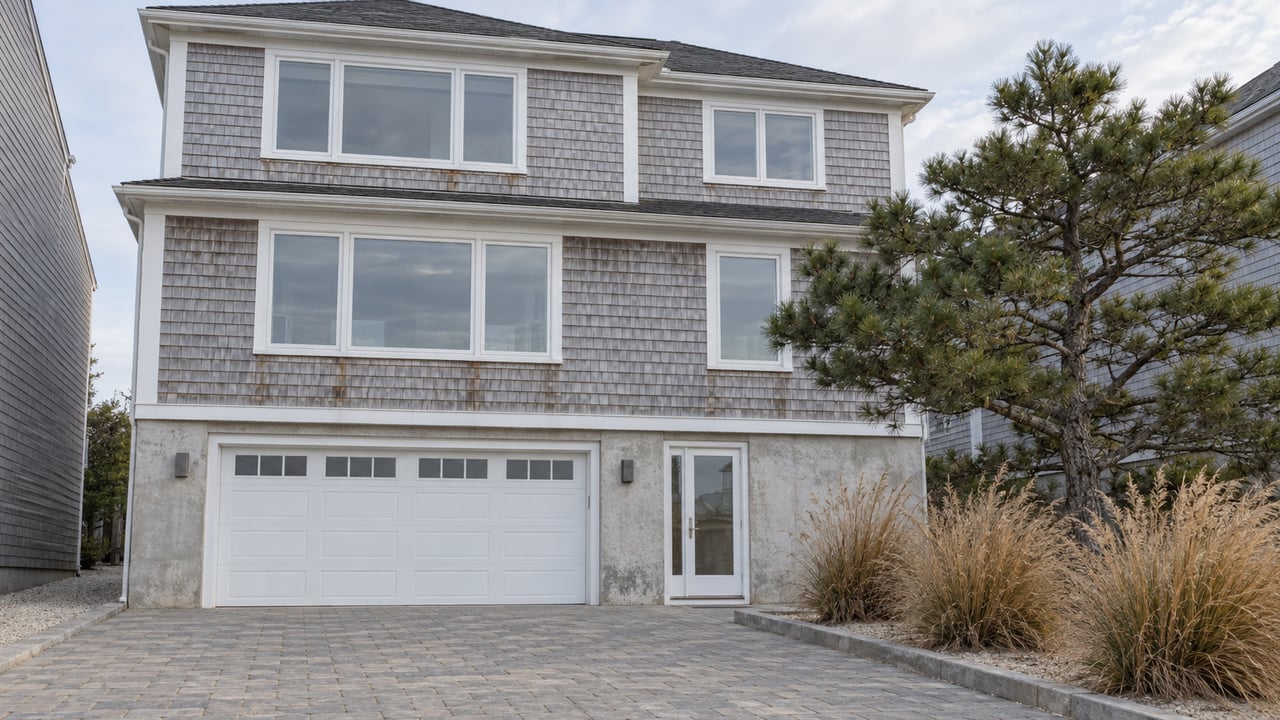
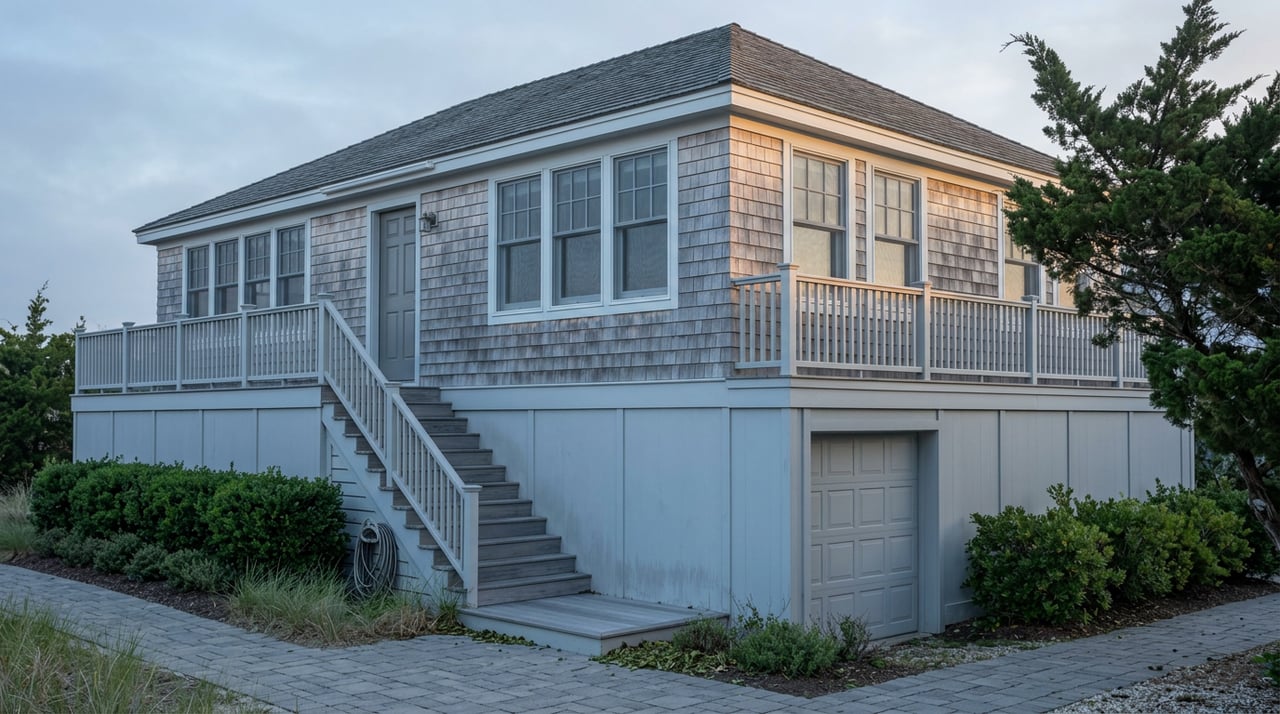
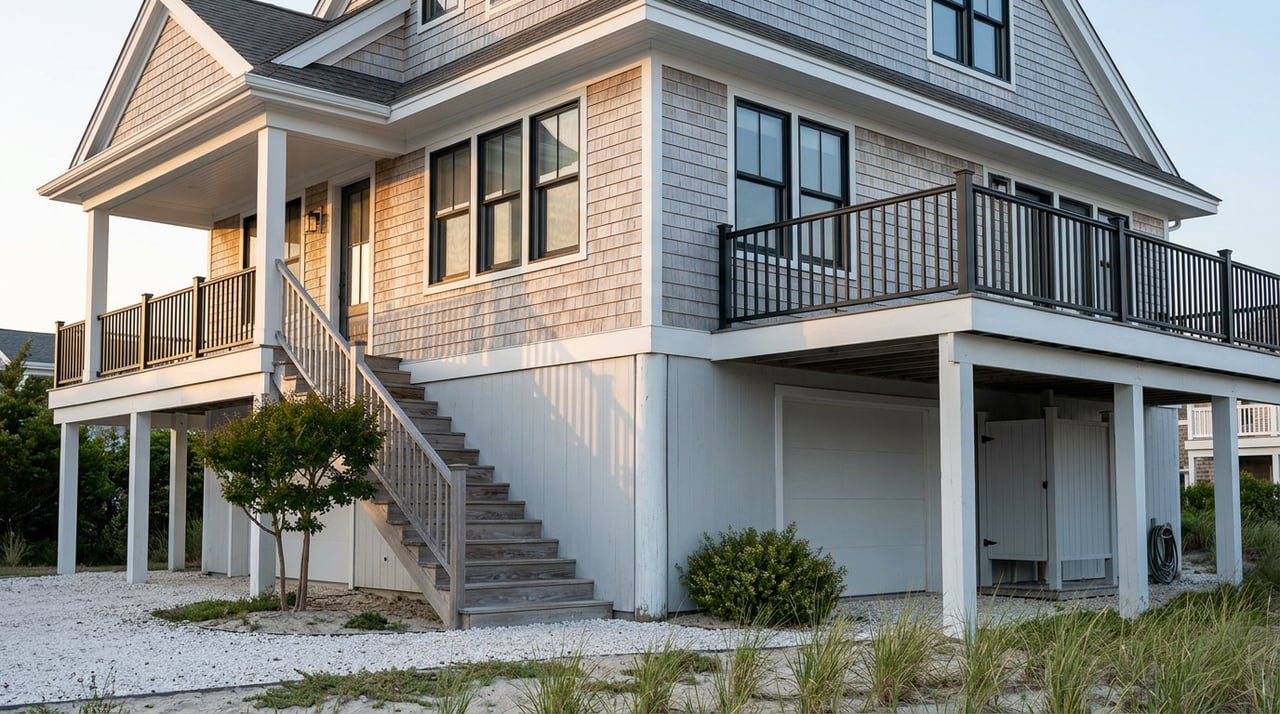
Part of that composition, this year, includes new construction. One active Ship Bottom listing this year sits on an oversized 60-by-100-foot lot in the heart of town, offering more than 3,500 square feet, well above what most of the borough's older cottages and Cape-style homes carry on standard 50-by-100 lots. A newly built five-bedroom home in neighboring Surf City, built by Building LBI with design work from Musgnug & Associates, shows the same pattern: a saltwater pool, custom millwork throughout, and finishes priced and sized well past the town's typical existing stock.
When new construction like this closes in a thin market, it pulls the average price per square foot toward itself. A handful of large, fully finished new builds selling at premium per-square-foot rates can outweigh a larger number of older three-bedroom cottages selling at their usual rate. The town's typical home has not repriced itself 125% higher in a year. What sold in that window simply included more of the expensive end of the spectrum than usual.
Surf City tells the opposite version of that story. It sold fewer homes this May than last (10 versus 16), which usually points toward a slowing market. But its price per square foot still moved a normal, explainable amount, because Surf City has more transaction volume in an ordinary year and a deeper bench of comparable homes. Losing six sales out of sixteen doesn't reshape the average the way gaining six sales out of five does.
Days on Market Is the Number Worth Trusting Here
If price per square foot is the noisy number this season, days on market is the steadier one, and it still tells a real story. Both towns saw buyers move faster. Ship Bottom's drop, from 154 days to 32, is dramatic even accounting for the mix shift, because faster-selling new construction alone wouldn't explain a swing that large. Some of that speed reflects genuine demand for Ship Bottom specifically. It's the borough where Route 72 crosses Manahawkin Bay and lands on the island, which is why the town carries the official nickname "Gateway to Long Beach Island," and it still holds a lower price floor than towns further out toward the northern end.
Surf City's days-on-market drop, from 120 to 65, is smaller in absolute terms but happening in a market with roughly half the annual sales volume drop that would normally slow a town down. Buyers there are still willing to move quickly even as fewer homes trade hands, which points to demand outpacing what sellers are willing to list, not a cooling interest in the town.
The Season This Data Is Capturing
It matters that this window sits in spring. April and May are typically when inventory peaks island-wide, as owners who held through winter list ahead of the summer rental season. Once June arrives, a portion of unsold listings on Long Beach Island quietly come off the market each year as owners shift them into summer rentals instead, some commanding $15,000 to $20,000 or more a week at the peak of the season. That means the spring snapshot we're looking at reflects a market with unusually high inventory and unusually motivated sellers, not necessarily what the fall resale market will look like once rental season winds down and true year-round sellers return to the table.
New construction has been reshaping pricing across Long Beach Township and the surrounding LBI towns for a couple of years now, and Ship Bottom's spring data is consistent with that broader pattern rather than separate from it.
What This Means If You're Comparing the Two Towns
If you're weighing Ship Bottom against Surf City right now, the headline price-per-square-foot gap is not the number to build a decision around. A few better questions get you closer to the truth:
- Was the recent comparable sale a new build or an existing home? A 3,500-square-foot new construction on an oversized lot and a 1,400-square-foot 1970s cottage are not the same market, even if they're three blocks apart.
- How many total sales sit behind the average you're looking at? A town moving five to eleven sales a month will have noisier numbers than one still moving ten to sixteen.
- Has days on market trended down across a full season, or is it one month's snapshot? Ship Bottom's speed is real, but it's worth watching whether it holds once summer rental listings clear out of the data in the fall.
For sellers in Ship Bottom, this is also a pricing caution. If your comps include one or two new-construction closings, your existing home is not automatically worth what those comps suggest per square foot. A conversation about which sales actually compare to your property, not just which sales happened nearby, is worth having before a number goes on a sign.
A Few Questions Worth Asking
Is Ship Bottom actually cheaper than Surf City right now? On median sale price, yes, by roughly $700,000 over the same three-month window. But that gap reflects two different housing stocks and two different transaction volumes, not a straightforward apples-to-apples discount.
Does a 32-day average mean I need to make an offer immediately? It means well-priced, move-in-ready homes are moving quickly this year. It doesn't mean every listing is equally in demand. A home priced against a new-construction comp it can't match may still sit.
Will this fast pace hold into fall? Worth watching. Spring data in a rental-heavy market like this one carries more seasonal noise than a full-year trend would.
If you're trying to figure out what a specific Ship Bottom or Surf City property is actually worth once the new-construction noise is stripped out, that's exactly the kind of comparison worth walking through with someone who tracks these blocks closing by closing. Paula E Brennan works both towns and can pull the comps that actually match your situation. Let's Connect.